| Category | Details & Overview |
| Topic | Risk Assessment, Project Management & Decision Frameworks |
| Main Focus | Building and using an effective risk matrix for safety |
| Key Categories | High Risk, Medium Risk, Low Risk |
| Core Components | Likelihood (Probability) & Impact (Severity) |
| Popular Frameworks | eisenhower matrix, raci matrix, ansoff matrix, bcg matrix |
| Target Audience | Project managers, business owners, safety officers, and students |
| Primary Benefits | Prevents accidents, saves money, lowers stress, and speeds up decisions |
Mastering the Risk Matrix: Your Ultimate Guide to Smart Planning
Planning a new project can feel like a big adventure full of unknown surprises. Every business path has hidden bumps, but smart leaders prepare for them ahead of time. That is where a practical risk matrix becomes your best friend. This visual tool helps you spot potential problems early so you can solve them quickly. Whether you run a small business or direct a large team, assessing hazards keeps your plans safe. In this guide, we will break down how grids work, how to build your own chart, and how different types of visual matrices make daily decisions much easier for everyone.
What Is a Risk Matrix and Why Do You Need One?
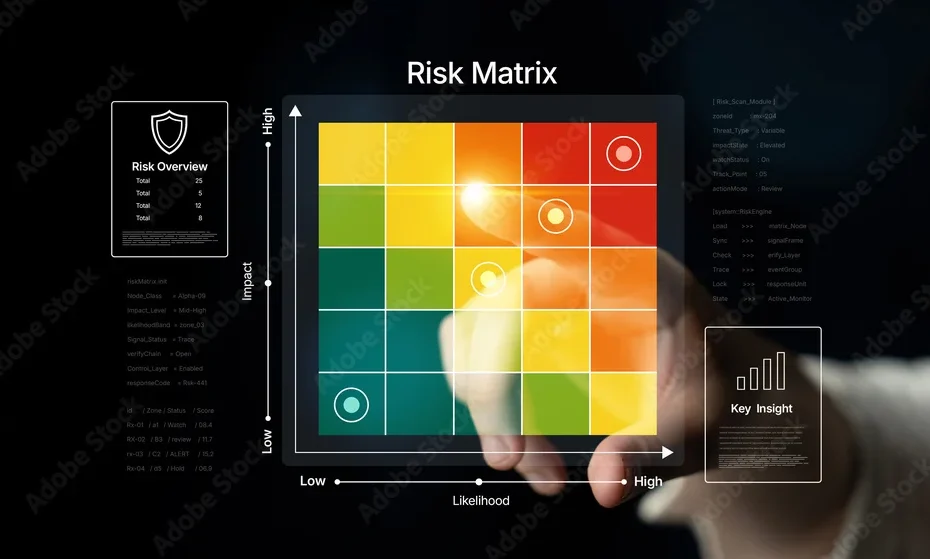
A risk matrix is a simple chart that helps you measure potential project hazards. It places the likelihood of a problem happening on one side of the grid. On the other side, it measures how bad the damage would be if that problem occurs. By matching these two factors, you get a clear score for every potential issue. This score tells you which problems need instant action and which ones can wait. Using a risk matrix keeps your entire team focused on what truly matters most. It turns scary, confusing uncertainties into a clear, manageable plan.
The Key Components: Likelihood vs Impact Explained
To use a risk matrix correctly, you must understand its two main building blocks. Likelihood means how probable it is that an unwanted event will happen soon. Impact means how much damage or loss that event will cause to your project goals. You usually rate both factors on a simple scale from 1 to 5. Multiplying these two scores gives you a clear rating for each identified hazard. When you map hazards on a risk matrix, your team can quickly agree on priorities. This simple math stops people from panicking over tiny, harmless glitches.
How Color Codes Simplify Your Risk Assessment
Most people love using a risk matrix because it relies on easy color codes. Green boxes represent low-level hazards that require minimal attention during weekly check-ins. Yellow boxes show moderate hazards that need regular monitoring and minor backup plans. Red boxes highlight severe threats that require immediate action and active prevention strategies. Looking at a colorful risk matrix gives you a complete safety picture in just a few seconds. This simple visual format makes complex safety reports easy for clients, bosses, and team members to understand without confusion.
Step-by-Step: How to Build Your First Chart
Creating your own risk matrix is a straightforward process that anyone can quickly master. First, gather your team for a brainstorming session to list every potential threat. Next, assign a likelihood and impact score to every item on your list. Place each item into its matching grid box on your simple risk matrix. After sorting the grid, write down clear action steps for every single red box. Review your completed risk matrix regularly, as project conditions can change rapidly over time. Keeping your chart updated ensures your team stays completely prepared.
Comparing Different Tools: How a Matrix Shapes Decisions
Grid tools extend far beyond hazard management into many different areas of business planning. A matrix structure helps organize teams, while specialized charts help solve marketing, math, and daily task problems. For example, business leaders use an ansoff matrix to plan company growth across new and existing markets. Marketing teams often rely on a boston matrix or a bcg matrix to decide which products deserve more budget. While a risk matrix protects your current operations, these other grid tools help you build exciting new opportunities for long-term success.
Task Management: Using the Eisenhower Matrix for Daily Focus
When daily work becomes overwhelming, organizing your priorities is crucial to staying productive. The eisenhower matrix helps you sort tasks by urgency and importance into four clear quadrants. Tasks that are both urgent and important go straight to the top of your daily list. You can delegate or skip tasks that add very little real value to your goals. Just like a risk matrix flags major hazards, this productivity grid highlights your most valuable daily tasks. Combining both methods reduces personal stress, keeps your workplace organized, and sharpens your mental focus.
Role Clarity in Projects: The Power of a RACI Matrix
Clear communication is vital when managing projects, especially when dealing with critical hazard responses. A raci matrix outlines who is Responsible, Accountable, Consulted, and Informed for every single project task. Without clear roles, important safety duties identified on your risk matrix might fall through the cracks. Knowing exactly who owns each step prevents confusing delays during unexpected operational emergencies. When every team member knows their exact duties, overall workplace confidence grows rapidly. Clear role grids eliminate finger-pointing and build a truly supportive team environment.
Technical and Business Grids: From Structure to Data Science
Modern organizations rely on specialized grid frameworks across technical disciplines, data science, and operational planning. Companies adopting a matrix structure organize employees under both project managers and functional department heads. In data science, engineers evaluate machine learning accuracy using a confusion matrix to track correct and incorrect predictions. Meanwhile, mathematicians use identity matrix rules and advanced matrix multiplication calculations to power computer graphics and physics modeling. Instead of calculating complex equations manually, analysts use a matrix multiplication calculator to process multi-step formulas quickly and accurately.
Cultural Pop Culture: Movies, Style, and Digital Trends
The word grid also holds a huge place in modern media, pop culture, and personal style. Millions of movie fans loved watching the matrix when it revolutionized science fiction film history. The story continued years later with matrix resurrection, which added new chapters to the matrix 4 storyline. Viewers still love discussing the talented cast of the matrix and exploring the mysterious universe of the matrix franchise. Today, people even explore spiritual trends using a destiny matrix chart to study personal life paths and personality traits.
Everyday Consumer Uses: Haircare Products and Salon Styling
Beyond business strategy, math equations, and blockbuster movies, the name represents top beauty and salon products. Many people use matrix shampoo daily to keep their hair healthy, strong, and shiny. Hairdressers frequently recommend the popular matrix food for soft line to hydrate dry hair during deep conditioning treatments. Whether you are using a risk matrix at work or enjoying premium hair products at home, grid concepts touch many areas of daily life. Embracing structured, organized tools simply makes modern living smoother, easier, and much more manageable.
Real-World Case Study: Preventing Project Delays with a Risk Matrix
Let us look at a practical example of project safety planning in action. Imagine a construction team building a new office building downtown during the rainy season. By setting up a risk matrix, they spot potential supply shipping delays caused by severe weather early. They rate the weather hazard as a high red threat due to its massive financial impact. Because their risk matrix highlighted this danger early, they order backup building materials weeks ahead of time. As a result, the project finishes on schedule without wasting extra money or suffering frustrating delays.
Frequently Asked Questions (FAQs)
1. What is the main purpose of a risk matrix?
The main purpose is to identify, score, and prioritize potential project hazards visually. It helps teams focus resources on severe threats while keeping low-level risks under simple observation.
2. How often should a team update their risk matrix?
You should update your chart during major project milestones or whenever big changes happen. Regular monthly reviews keep your team prepared for new hazards that may develop over time.
3. What is the difference between a risk matrix and a RACI matrix?
A risk matrix evaluates potential project hazards based on likelihood and severity. A RACI matrix assigns team roles and responsibilities for specific project tasks to ensure clear accountability.
4. Can small businesses benefit from using a risk matrix?
Yes, small businesses benefit greatly from simple risk charts. Spotting potential cash flow or supply issues early helps small business owners avoid costly surprises and build stable growth.
5. What are the two axes on a standard risk matrix chart?
The horizontal axis usually shows the severity or impact of a potential problem. The vertical axis measures the likelihood or probability of that problem actually taking place.
6. What makes the Eisenhower matrix different from risk planning?
The Eisenhower matrix focuses on personal time management by organizing daily tasks by urgency and importance, whereas risk charts evaluate external project threats and operational safety.
Conclusion: Take Control of Your Projects Today
Using a practical risk matrix is one of the smartest habits you can build for long-term project success. It removes guesswork, protects your team, and turns chaotic hazards into structured, step-by-step action plans. By combining hazard grids with productivity tools, you build a safer and more efficient workplace. Do not wait for unexpected problems to derail your hard work and ruin your goals. Gather your team, map out your potential hazards on a simple grid today, and take confident control of your future!